
July 27, 2026
If a metric does not drive a decision, drop it
A practical path from conflicting spreadsheets to a Single Source of Truth: sources, ETL, warehouse, semantic layer, Power BI and AI. The real goal is shorter time between a business question and a reliable decision.

Almost every company has some dashboard. Many have too many. Few have a Single Source of Truth: a measurement vocabulary that leadership, marketing, sales and IT use without arguing.
The usual symptom: three spreadsheets, two Power BI reports and a CRM export telling different stories about the same month. The problem is rarely "we lack Power BI" or "we need BigQuery". It sits upstream: dirty sources, missing integrations, metrics without owners.
The real goal of BI is not to build dashboards. It is to shorten the time between a business question and a reliable decision.
At Syncronika this path lives in the data analytics perimeter and on the executive reporting page. Warehouses, lakes, BI and AI enter when they serve the path, not as a fashion project.
The path in seven stages
This is not a glossary. It is a journey: each stage unlocks the next.

- Problem · conflicting numbers, slow decisions
- Data sources · CRM, e-commerce, ads, ERP (OLTP)
- Cleansing · quality, dedupe, rules
- Integration · batch or streaming, ETL / ELT
- Warehouse · model, history, Single Source of Truth
- BI · reading layer + semantic layer ("revenue" the same for everyone)
- Targeted AI · only after definitions and pipelines
You can skip sections. Do not skip the order: putting Power BI or AI at step 1 reproduces the mess, prettier.
1. The problem: no single truth
A dashboard only earns its place if it answers questions someone actually asks, on a cadence, with follow-up.
Honest examples:
- Which leads deserve a call this week? (SaaS / B2B services)
- Where does the funnel break between campaign and order? (e-commerce)
- Is support cost rising because of volume or data quality? (services / helpdesk)
- Does channel X margin hold after returns? (retail / manufacturing)
If nobody acts on the number, remove the tile. Fewer charts, more indicators with owners.
Single Source of Truth means: one shared definition for each critical metric, fed by governed sources, readable by every role without "my spreadsheet version".
Without it, every meeting restarts with "my numbers say otherwise".
2. Data sources: where everything starts (or dies)
CRM, e-commerce, ads, helpdesk, ERP: typically OLTP databases (Online Transaction Processing). Contacts, orders and tickets live here. If fields are duplicated, empty or contradictory, no BI downstream will save you.
Do data enrichment and CRM intelligence first, then reports.
Examples by sector
| Context | Typical sources | Question that must reconcile |
|---|---|---|
| E-commerce | Shopify / Magento, ads, warehouse | Net orders vs returns by channel |
| B2B SaaS | CRM, billing, product analytics | Pipeline and churn in one vocabulary |
| Manufacturing | ERP, MES, quality | Cost, scrap, lead time on one model |
| Services | CRM, helpdesk, timesheets | Margin per project and SLAs |
3. Cleansing: rules before charts
Customer dedupe, required fields, inbound checks, ID mapping (CRM vs e-commerce vs billing). Unglamorous work, and far more useful than a third Power BI.
Without cleansing, every pipeline copies the mess into the warehouse.
4. Integration: how data reaches the model

Batch or streaming
Batch (periodic windows: night, hour, day close): ideal for master data, consolidated orders, ads exports, ERP snapshots. Easier to audit and reprocess. Limit: BI data is frozen at the previous window.
Streaming (or near real time: webhooks, queues, CDC, clickstream): fits inventory, anomalies, live support, campaigns that must react in minutes. Costs more in complexity. If nobody acts on the minute, it is theatre.
Hybrid (the norm): batch for finance and "official" warehouses; streaming only where latency changes an operational decision.
Ingestion frequency should follow decision frequency, not the reverse.
ETL and ELT: how data enters the warehouse
ETL (Extract, Transform, Load): extract, transform (cleansing, joins, rules), then load into the warehouse. Useful when you want to control transformation before touching the analytical store.
ELT (Extract, Load, Transform): load first (even raw) into the warehouse or lake, then transform there (SQL, dbt, procedures). Useful with elastic cloud engines (BigQuery, Snowflake, Fabric) where transformation scales better at the destination.
This is not a war of acronyms. It is a choice of where business logic lives and who versions it.
When you design integrations, ask: batch, streaming or both? ETL or ELT? What freshness SLA? Who reprocesses when a load fails?
5. Warehouse (and lake): home of analytical truth
OLTP and OLAP: two databases, two jobs
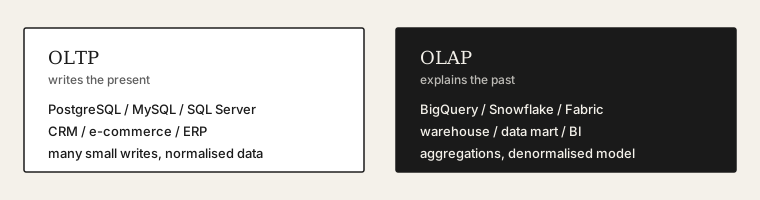
OLTP: writes the present. Examples: PostgreSQL, MySQL / MariaDB, SQL Server, Oracle (often behind CRM or e-commerce, or on RDS / Cloud SQL).
OLAP: explains the past and prepares the decision. Examples: BigQuery, Snowflake, Amazon Redshift, Microsoft Fabric / Azure Synapse, Databricks SQL; in leaner setups also ClickHouse. Power BI usually reads from here, not from production Postgres.
Classic mistake: heavy reports on production MySQL/Postgres. Opposite mistake: a warehouse that copies dirty sources.
When a warehouse becomes useful
A warehouse becomes useful when decisions start depending on data from multiple systems, when you need reliable history, when you want to version KPIs, or when the operational database is no longer the right place for analysis (locks, timeouts, numbers that move while someone is saving).
It is not "only if you are large". It is "when analysis can no longer live inside the ERP".
A data lake keeps raw or semi-structured data (logs, events, files). It helps with high volume or experiments. It does not help if the problem is "sales does not trust the CRM".
In short: lake = raw archive, warehouse = model for decisions, BI = reading layer.
Denormalising for BI
In OLTP databases data is often normalised. On the OLAP side you usually denormalise in a controlled way: star model (facts + wide dimensions), canonical keys, fewer invented joins in Power BI.
Not a monster CSV. A read model where marketing and finance get the same number.
dbt (essential mention)
dbt (data build tool) is now a de facto standard for modelling warehouse transformations: versioned SQL, tests, docs, environments. It does not replace BigQuery or Snowflake: it makes them governable. If someone only talks about "loading tables" without how transformations are versioned, ask about dbt (or an equivalent).
6. BI and the semantic layer: "revenue" the same for everyone
Power BI is strong at visualising and distributing reports in Microsoft-heavy companies. Looker, Metabase and others work just as well. The tool matters less than three conditions:
- Shared definitions
- Reliable pipelines
- Review ritual (metrics you are allowed to drop)
The semantic layer
Today's real problem is often not the dashboard. It is having "revenue" the same for everyone.
The semantic layer is where business metrics and relationships live, independent of any single report:
- Power BI Semantic Model / Microsoft Fabric Semantic Model
- LookML (Looker)
- dbt Metrics / MetricFlow
- Cube, AtScale, Transform and other metric layers
Without it, every analyst reinvents the KPI in DAX or SQL. With it, the Single Source of Truth becomes consultable.
If two teams must debate the formula for "net revenue" inside the chart, the semantic layer is not there yet.
7. Where AI helps (and where it does not)
AI on data is useful in precise places. Not as a substitute for a measurement model.
It makes sense when you:
- classify tickets, notes or documents (see document processing);
- flag anomalies ("return rate off threshold on channel Y");
- summarise already governed metrics for leadership;
- speed up mapping and cleansing under human supervision.
It does not make sense when you:
- ask a model to invent the missing KPI;
- use an agent to narrate conflicting numbers as one truth;
- buy a BI copilot before owners, definitions and a semantic layer.
As in AI everywhere? Often you still solve it without AI, many companies fix rules, integrations and data quality first.
Data governance: who decides on the metric
It is not enough to know who updates the data. You also need:
- who can change it;
- who approves a metric;
- who changes a definition (e.g. "qualified lead");
- where documentation lives (semantic layer, dbt, wiki).
That is data governance. Without it, the Single Source of Truth decays at the first turnover or the first Power BI "hotfix".
The short review ritual (cadence, actions, metrics to drop) is governance in practice, not only policy.
Operating checklist (no three-year programme)
- Source inventory and owners
- Cleansing and quality rules
- Minimal shared metrics (even CRM + a controlled sheet)
- Stable integrations (batch/streaming, ETL/ELT)
- Denormalised model + versioned transformations (dbt or equivalent)
- Warehouse when multi-source, history or separation from ops requires it
- BI wired to the semantic layer, not to random APIs
- Targeted AI, with control metrics
Each step has a stop. This is executive reporting wired to real stacks, not a brochure data platform.
What to ask the next vendor (or your internal team)
- Which decisions will change?
- Who owns each metric and who approves its definition?
- Which systems, at what freshness (batch/streaming), ETL or ELT?
- How do you build the Single Source of Truth and the semantic layer?
- Do you use dbt (or equivalent) to version transformations?
- Where do you propose AI, and how do you measure fewer errors versus more slides?
If answers are vague, you are buying tools, not decisions.
Where to start
If parallel spreadsheets, a barely used Power BI and an untrusted CRM coexist today, do not start from the cloud logo. Start from decisions and sources. Then integration, warehouse, semantic layer. AI comes later.
The real goal of BI is not to build dashboards. It is to shorten the time between a business question and a reliable decision.
Deep dives: data analytics, executive reporting, data enrichment. For your case: contacts.
You might also like

September 18, 2026
TechnologyWhy many dashboard problems do not start in Business Intelligence
When Power BI is slow or the numbers do not match, the issue is rarely the dashboard. It sits upstream: sources, transformations, data model and governance. How to think platform-first before the tool.
Read article
September 2, 2026
Artificial intelligenceFrom automation to AI agents: how to use n8n for systems that observe, understand and act
n8n is not only for connecting apps. It can orchestrate systems that watch operational signals, interpret context and trigger actions. When the tool is enough, and when you need custom code.
Read article
August 19, 2026
Artificial intelligenceHow to know where to actually invest in artificial intelligence
AI is not the starting point. It is the final multiplier of a strategy built on processes. How to find inefficiencies, calculate ROI and build a roadmap before chatbots, agents or Copilot.
Read article